John Snow’s 1855 map makes a deadly pattern visible. Its quiet boundary note also shows why a persuasive map needs careful reading.
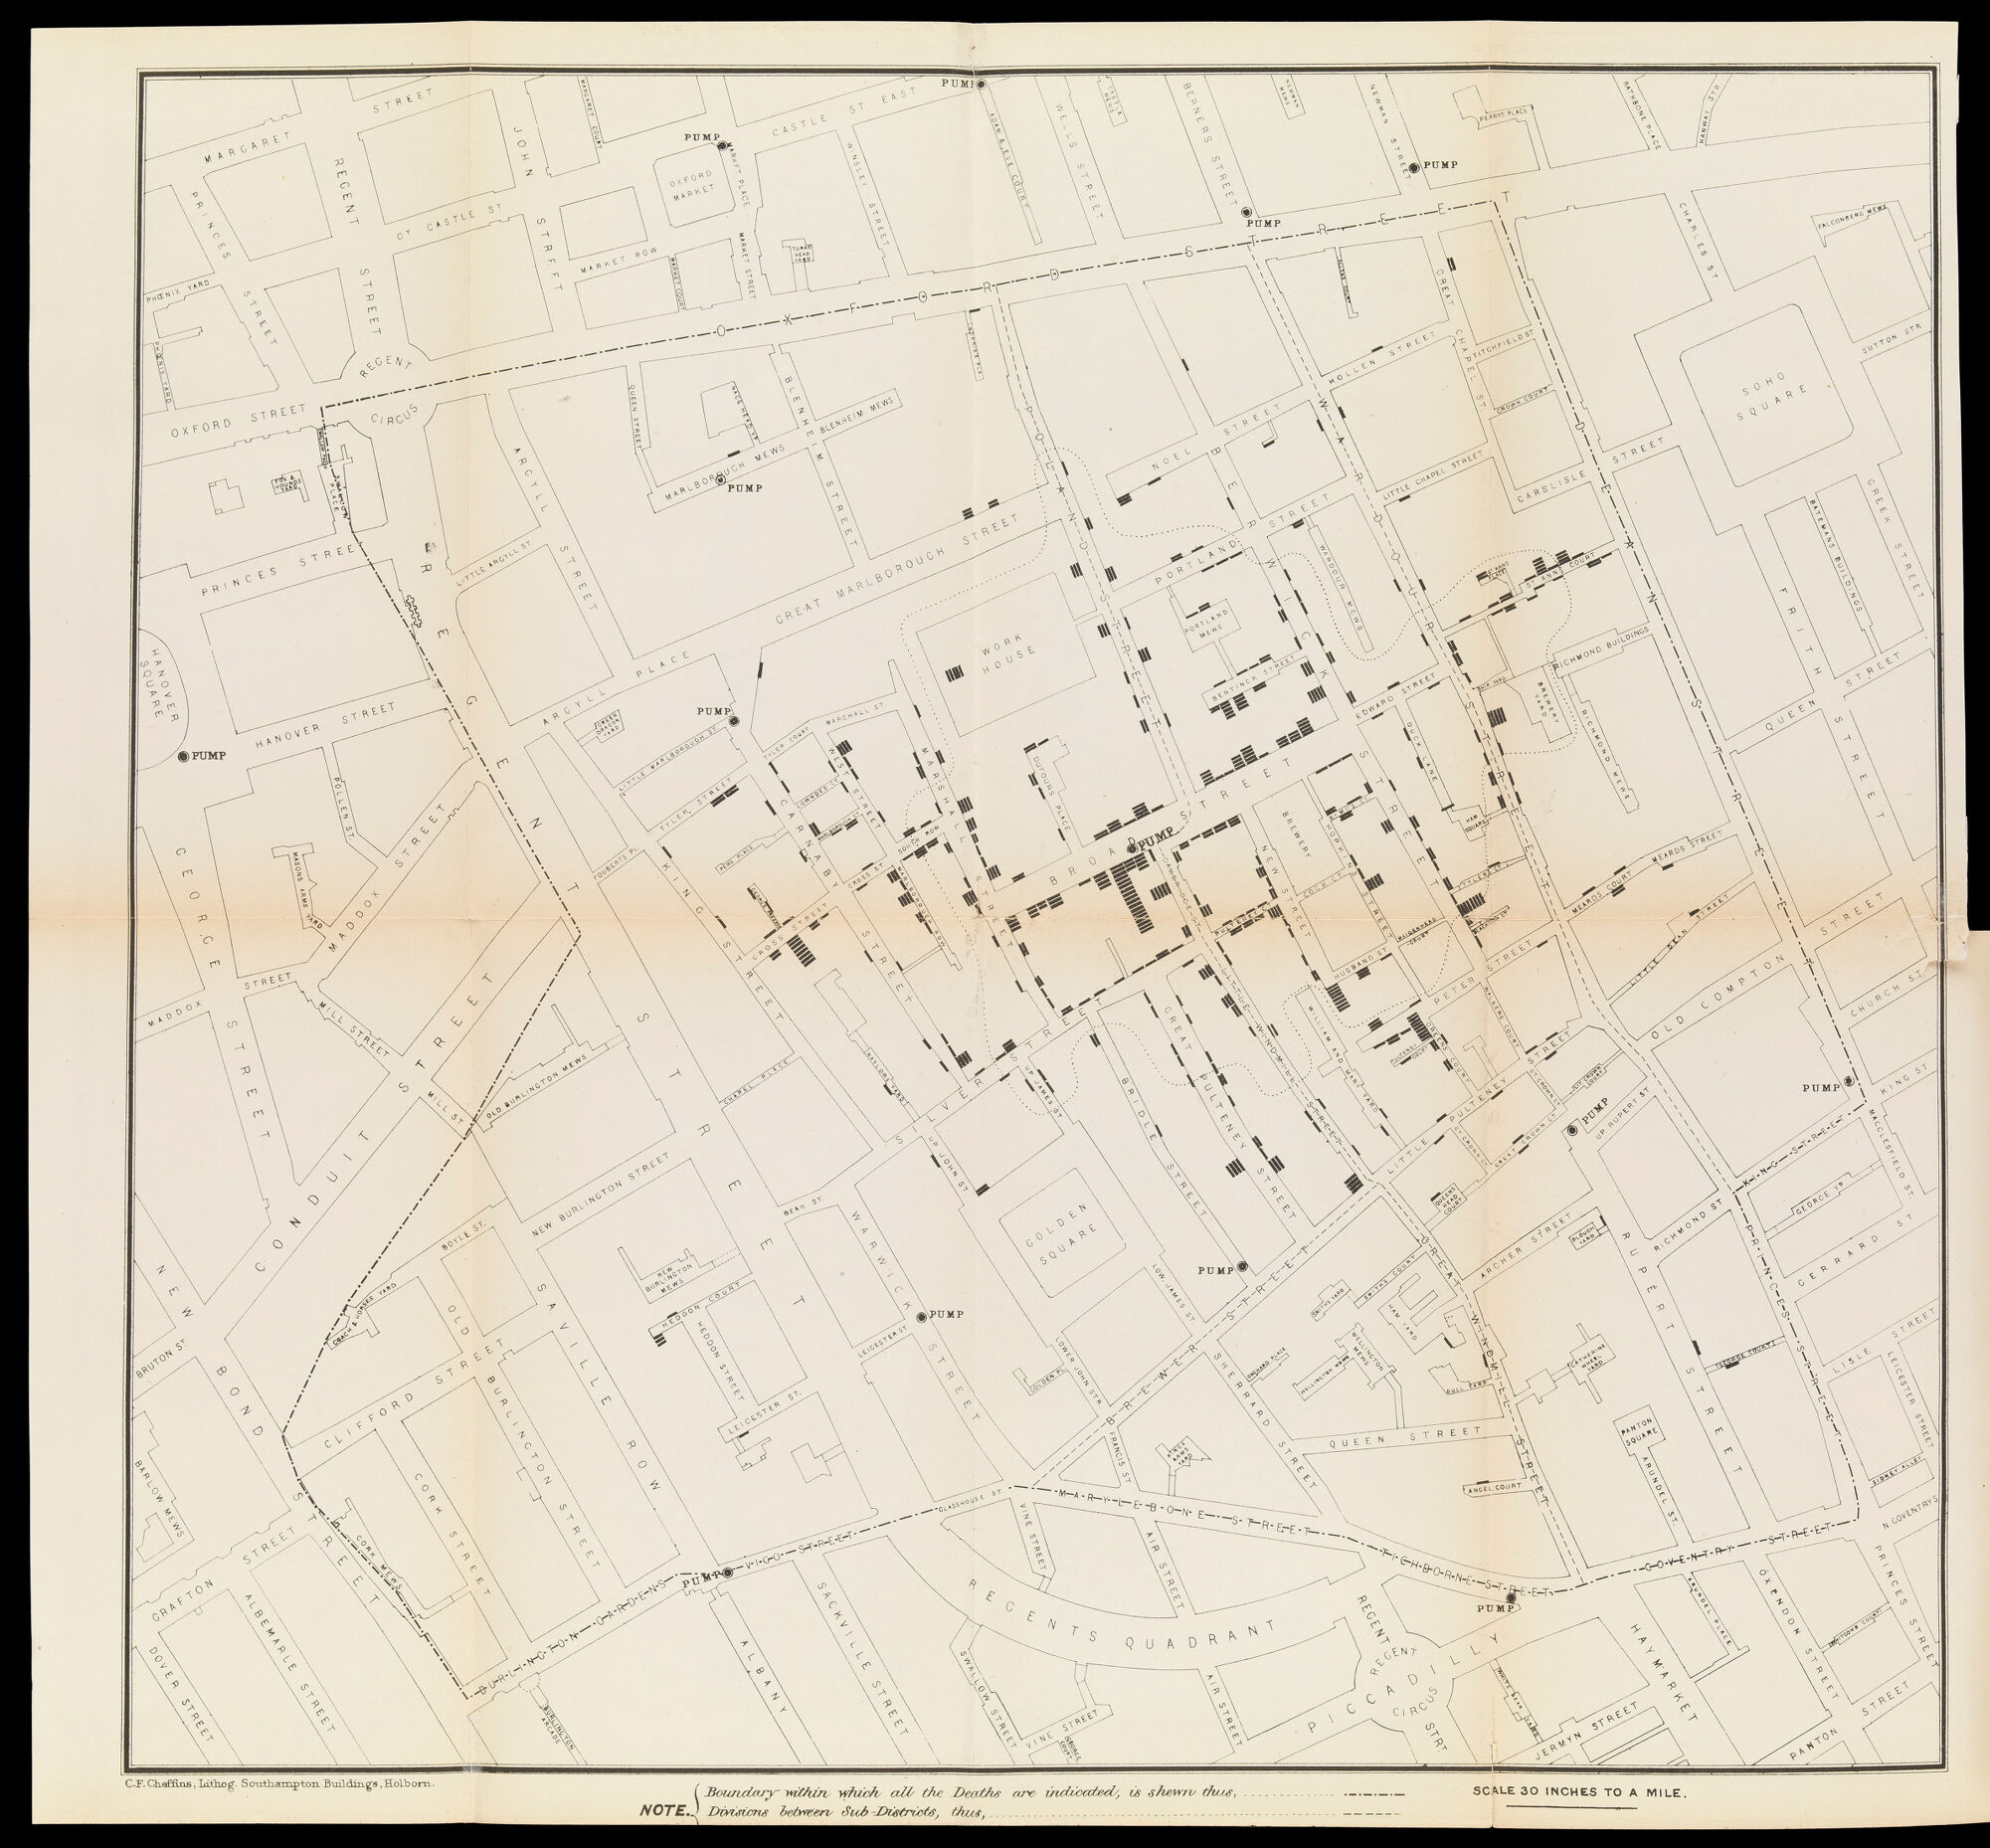
The darkest shapes on this map are surprisingly small. Short black strokes sit beside the streets, sometimes alone and sometimes stacked into heavy clusters. Street names, building outlines, and open squares are drawn much more quietly. Before a reader understands the story, the page has already established what deserves attention.
Each black bar represents a death. John Snow’s map concerns the cholera outbreak in London’s Soho district in 1854. The reproduction shown here comes from the parish inquiry report presented in July 1855, rather than from an unspecified modern redrawing. Wellcome Collection identifies its position in that report as pages 106–107.
A question given an address
Find Broad Street near the center. Around its marked pump, the bars gather thickly along the neighboring streets. Other pumps appear farther out. That relationship is the picture’s central proposition: the locations of deaths can be considered alongside a possible shared source of water.
As London Museum explains, Snow challenged the prevailing explanation that cholera spread through bad air. His investigation connected the Soho outbreak with contaminated water, and local authorities removed the Broad Street pump’s handle. The map belongs to that wider investigation. A printed pattern made the argument visible; it was not, by itself, every piece of evidence required to establish it.
The graphic restraint matters. There is no wash of ominous color spread across an entire neighborhood. Individual strokes keep the deaths countable in principle, even where they become difficult to distinguish on a small screen. A cluster is made of separate marks, and every mark refers to a person.
Read the foot of the map
A quieter detail changes how the whole sheet should be understood. The note along the bottom identifies a boundary within which all the deaths are indicated. It also gives a separate convention for divisions between sub-districts. These are not decorative lines.
That means an apparently empty area cannot automatically be treated as evidence that nobody died there. Before drawing that conclusion, a reader needs to know whether the area falls within the map’s stated coverage. The legend is part of the evidence, even though its lettering has far less visual force than the black clusters.
Our reading is that the sheet presents two different kinds of clarity. The bars offer an immediate pattern. The boundary note explains a limit on what that pattern can support. Removing the note would leave a more streamlined image and a less dependable argument.
The same distinction is useful when looking at maps today. Dark marks attract the eye, but the quiet questions still matter: What is counted? Over what period? Within which area? What would an absence of marks actually mean?
Snow’s map remains compelling because it joins an ordinary street plan to an urgent human problem. Reading it closely adds something to the familiar story. The discovery is not only in the concentration of ink around a pump. It is also in the discipline of noticing the modest instructions that tell us how far the picture’s claims extend.
Artwork & sources
Map from the Report on the cholera outbreak in the Parish of St. James, Westminster
John Snow; lithographed by C. F. Cheffins · 1855, mapping the 1854 outbreak · Printed map
Wellcome Collection, image L0072917. Public Domain Mark. Map from the 1855 parish cholera report, pages 106–107.
View the source object. Image: Public Domain Mark.
Historical and scientific details are grounded in the sources above. Interpretations of composition are Storied Spark’s own readings. Storied Spark is independent of the collecting institutions.
Comments
Post a Comment